Graph of literacy rates
A plot of male vs. female literacy rates constructed using freely available data from UNESCO and the World Bank
Figure 7.4.4 – Investigating literacy rate data in a spreadsheet
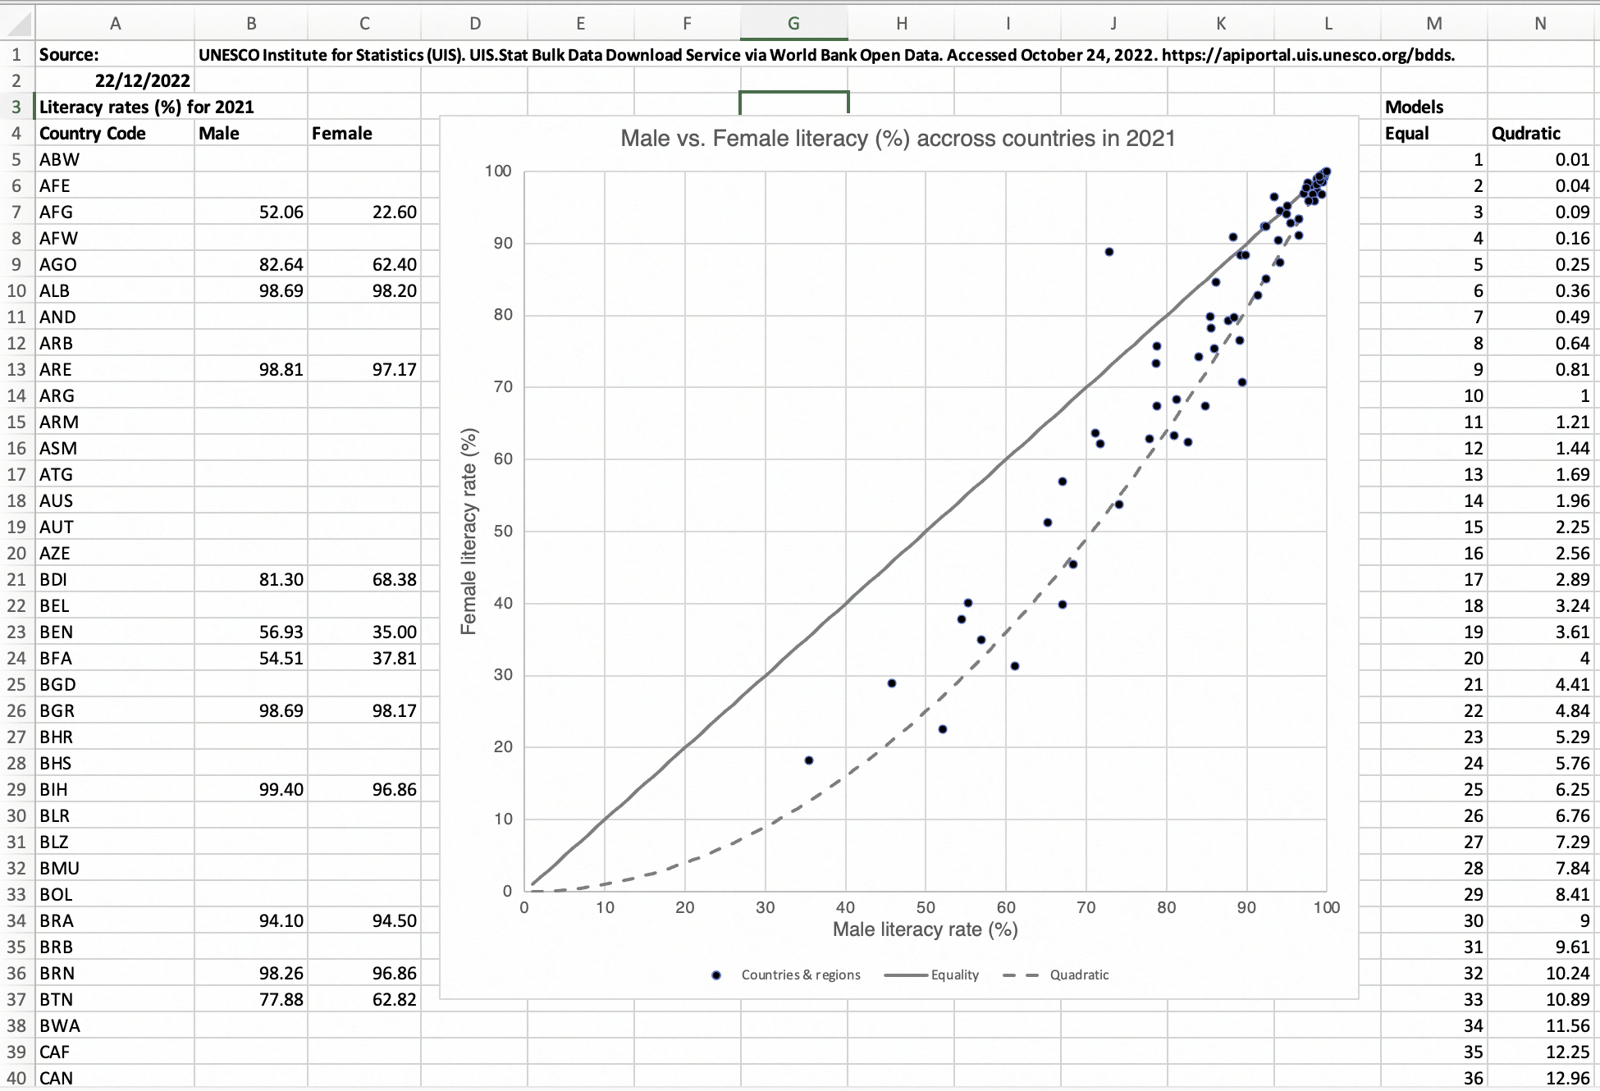
A plot of male vs. female literacy rates constructed using freely available data from UNESCO and the World Bank
Supporting material for the book Learning and Teaching for Mathematical Literacy by Hugh Burkhardt, Daniel Pead and Kaye Stacey (ISBN 9781032301174).
Contents of ltml.mathlit.org website – except where specified otherwise and excluding external link content - Copyright © Hugh Burkhardt, Kaye Stacey, Daniel Pead 2024, all rights reserved. These materials are offered "as is" with no warranty as to accuracy or fitness for purpose.
SIte operated by the BBDSC Trust