Knowing Where You Are – spreadsheet for detailed accounting
This is an example spreadsheet and pie chart to accompany section 9.1 of the book. More detailed instructions can be found below.
Creted by the book authors - free for educational use.
Figure 9.1.1 & 9.1.2 – A spreadsheet for detailed accounting
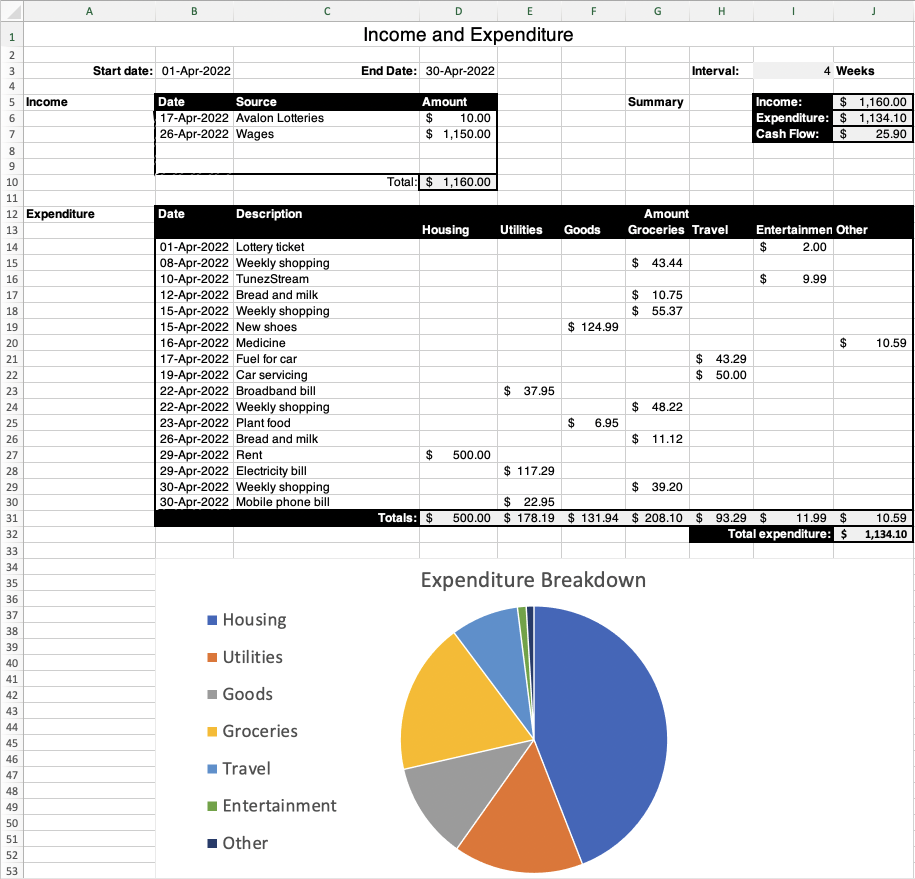
A Spreadsheet for Detailed Accounting
Over a typical month, where does your money come from, and what do you spend it on?
First, look at the Example tab to see some madeup data that shows how to fill in the sheet.
Next, go to the Income and Expenditure sheet and fill in your own data (or make something up).
The sheet will calculate your total income, total expenditure and "cash flow" for the period.
Now you can go to the Pie Charts tab and see a breakdown of your expenditure across different categories. This doesn't have any numbers, so you can share it with others without giving away details of your finances.
What do you spend most of your money on? If you wanted to save money, what would be the easiest thing to cut back on?
Note:
- We have used '$' for the currency because it is widely recognised – you can change this using the spreadsheet's formatting functions if you wish.
- A number shown in brackets, like (100), is negative, the same as -100. This is common in accountancy. What does it mean if your cash flow is negative?